The sharp drop in new Ontario teaching licenses issued in 2016, following a multi-year decline in new entrants to the Ontario teaching market, resulted in a strong improvement in early-career teacher employment outcomes in the 2016–17 school year.
French as a second language and French-first language teachers continue to enjoy high demand and low rates of unemployment in the first year after licensure.
English-language education graduates report much improved job outcomes across all divisions. Intermediate-Senior qualified math and science teachers are quickly returning to the high demand market of a decade ago.
Annual supply of new teachers will remain at historic lows for the next several years as teacher retirements rise gradually from year to year. The years ahead will bring a near balance of annual new teachers and retirements, a supply and demand circumstance that should extend this recent improving job market throughout the province.
The next few years will require vigorous recruitment by Ontario’s school boards, not only to fill vacancies in the current high demand qualification areas, but increasingly to fill occasional teaching, long-term occasional (LTO) and permanent positions across the board.
2014: 34%.
2015: 42%.
2016: 47%.
2017: 62%.
French as a Second Language
2014: 11%.
2015: 3%.
2016: 5%.
2017: 4%.
French-Language Program
2014: 18%.
2015: 4%.
2016: 9%.
2017: 0%.
English-Language Teachers
2014: 40%.
2015: 31%.
2016: 34%.
2017: 19%.
The 2017 survey results for French-language program graduates represent only six respondents.
2008 to 2011: 12,138 (actual).
2012 to 2015: 10,590 (actual).
2016: 3,600 (actual).
2017: 5,551 (actual).
2018: 5,380 (forecast).
2019: 5,425 (forecast).
2020: 5,575 (forecast).
2008: first year 59%, second year 72%, third year 77%, fourth year 85%, fifth year 89%.
2009, first year 41%, second year 62%, third year 66%, fourth year 80%, fifth year 87%.
2010: first year 33%, second year 47%, third year 64%, fourth year 72%, fifth year 79%.
2011: first year 33%, second year 39%, third year 59%, fourth year 68%, fifth year 72%.
2012: first year 29%, second year 34%, third year 47%, fourth year 57%, fifth year 66%.
2013: first year 28%, second year 37%, third year 39%, fourth year 51%, fifth year 53%.
2014: first year 37%, second year 43%, third year 50%, fourth year 50%, fifth year 59%.
2015: first year 46%, second year 48%, third year 56%, fourth year 66%, fifth year 69%.
2016: first year 52%, second year 56%, third year 63%, fourth year 66%, fifth year 67%.
2017: first year 62%, second year 64%, third year, 69%, fourth year 73%, fifth year 67%.
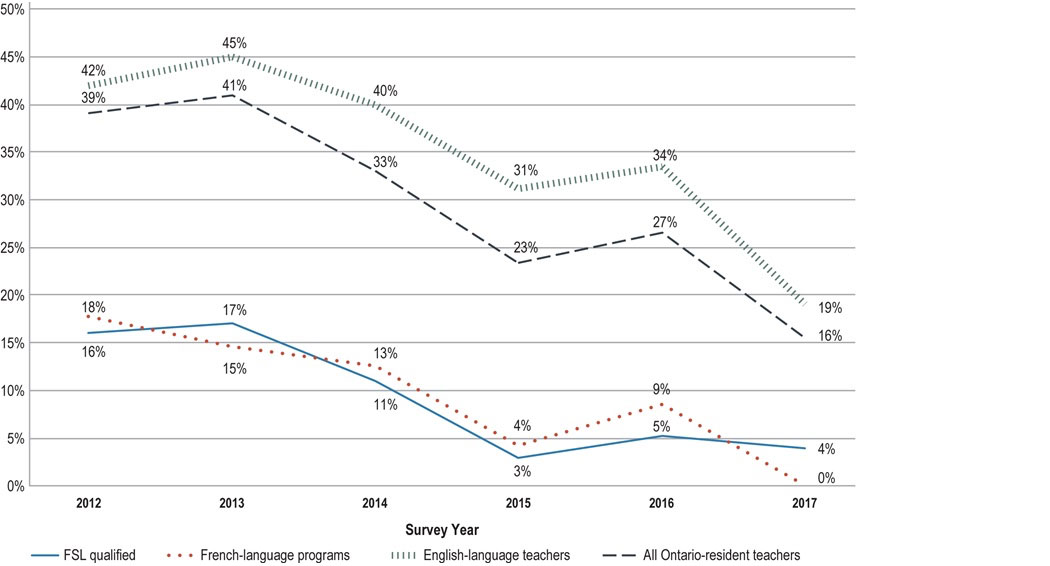
2012: 16% FSL qualified, 18% French-language programs, 42% English-language teachers, 39% all Ontario-resident teachers.
2013: 17% FSL qualified, 15% French-language programs, 45% English-language teachers, 41% all Ontario-resident teachers.
2014: 11% FSL qualified, 13% French-language programs, 40% English-language teachers, 33% all Ontario-resident teachers.
2015: 3% FSL qualified, 4% French-language programs, 31% English-language teachers, 23% all Ontario-resident teachers.
2016: 5% FSL qualified, 9% French-language programs, 34% English-language teachers, 27% all Ontario-resident teachers.
2017: 4% FSL qualified, 0% French-language programs, 19% English-language teachers, 16% all Ontario-resident teachers.
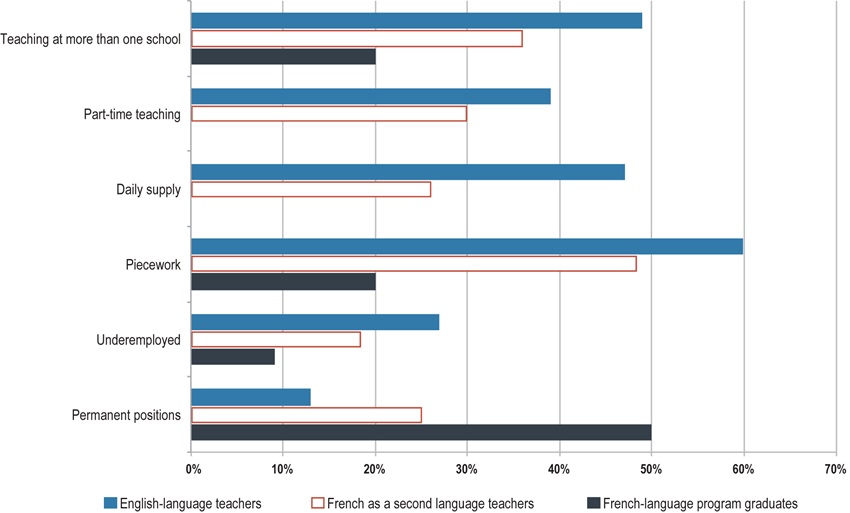
Teaching at more than one school: 49% of English-language teachers, 36% of French as a second language teachers and 20% of French-language program graduates.
Part-time teaching: 39% of English-language teachers, 30% of French as a second language teachers and 0% of French-language program graduates.
Daily supply: 47% of English-language teachers, 26% of French as a second language teachers and 0% of French-language program graduates.
Piecework: 60% of English-language teachers, 48% of French as a second language teachers and 20% of French-language program graduates.
Underemployed: 27% of English-language teachers, 18% of French as a second language teachers and 9% of French-language program graduates.
Permanent positions: 13% of English-language teachers, 25% of French as a second language teachers and 50% of French-language program graduates.
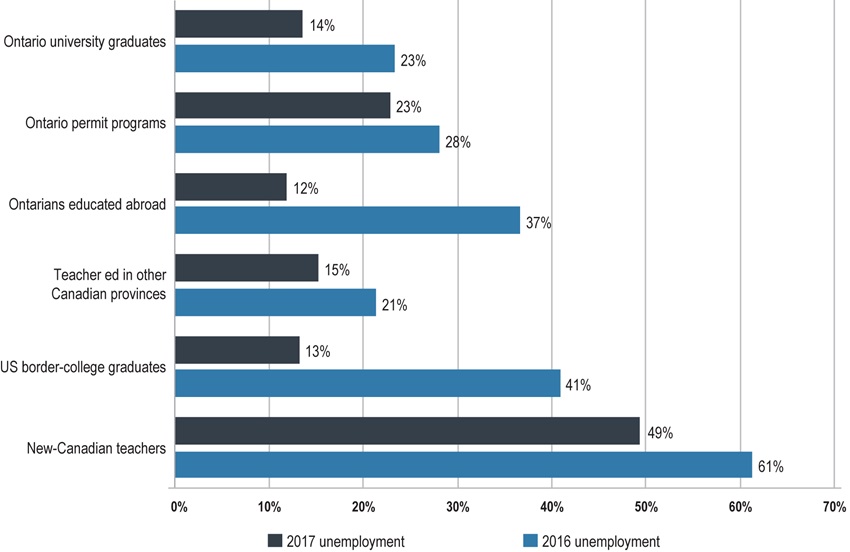
Ontario university graduates: 14% in 2017 and 23% in 2016.
Ontario permit programs: 23% in 2017 and 28% in 2016.
Ontarians educated abroad: 12% in 2017 and 37% in 2016.
Teacher ed in other Canadian provinces: 15% in 2017 and 21% in 2016.
U.S. border-college graduates: 13% in 2017 and 41% in 2016.
New-Canadian teachers: 49% in 2017 and 61% in 2016.